A Complete Guide to Exness Social Trading Strategy

What’s a social trading strategy?
A social trading strategy is an account created by a strategy provider in his Personal Area, for the purpose of performing trading. Investors are able to view these strategies on the social trading application and choose to copy them. On doing so, all trades on a particular strategy account will be copied onto client’s investment using copying coefficient.
The two accounts available for strategy creation are Social Standard and Social Pro for trading on MT4 platforms.
Social Standard: This strategy account can be created by a strategy provider with a minimum deposit of USD 500. It is similar to the Standard trading account available in the Personal Area.
Social Pro: This strategy account can be created by a strategy provider with a minimum deposit of USD 2000. It is similar to the Pro trading account available in the Personal Area.
Multiple strategies can be created and managed simultaneously by any strategy provider in his Personal Area.
What kind of information on a strategy can I find in the app?
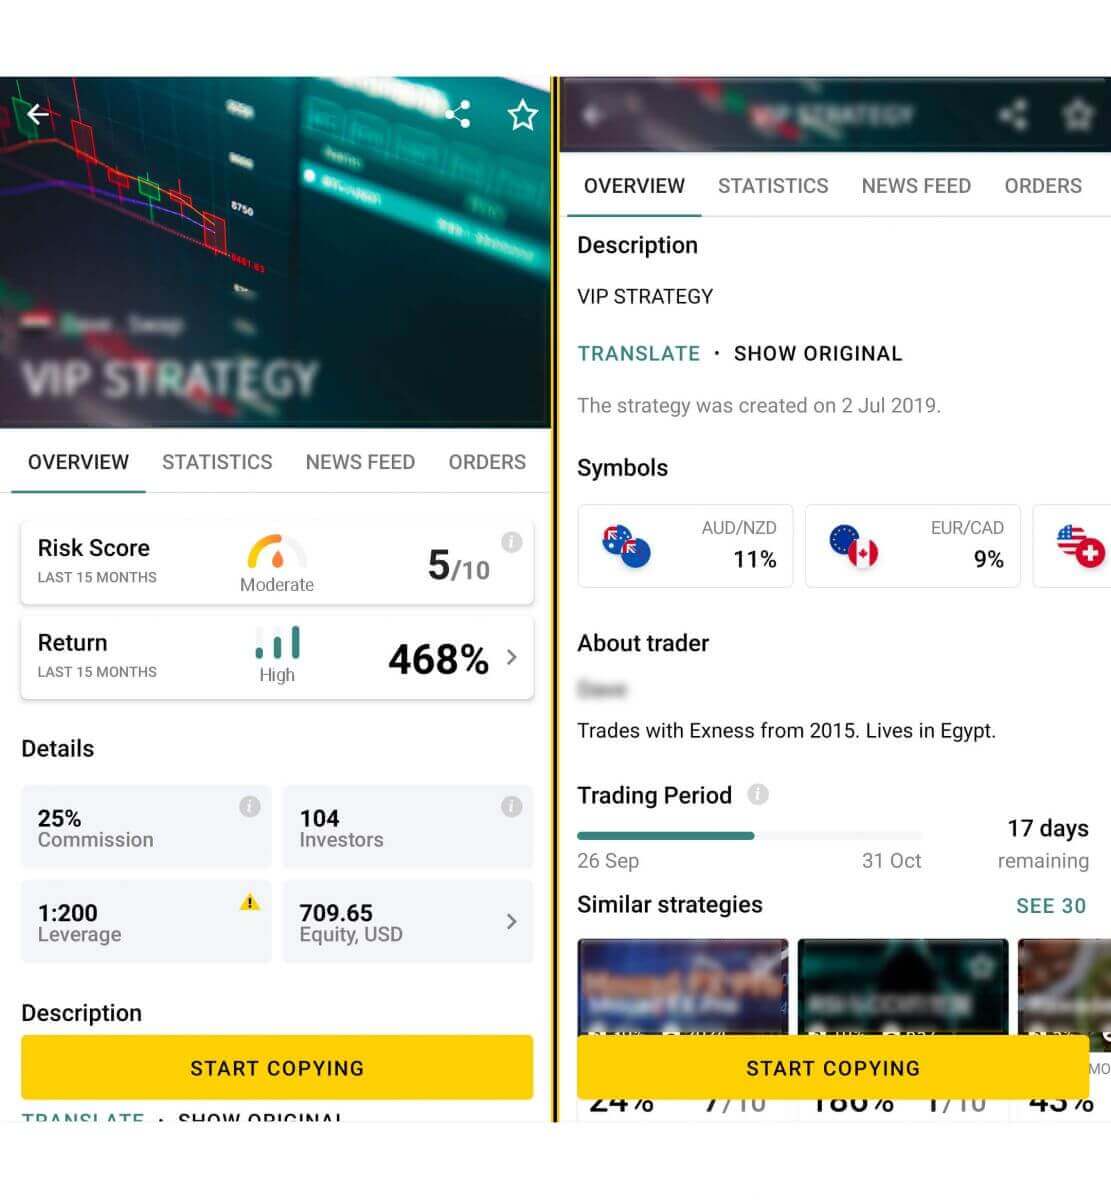
The Overview Tab in the Social Trading App details a number of important things to consider.
Risk Score
The risk score reflects the level of risk taken. The higher the score, the greater the risk and chance of making money, or losing money more rapidly.
Moderate: 1-5
High: 6-8
Extra High: 9-10
Return
This charts the growth seen in a specific strategy. Return is updated daily with statistics that calculate the change in a strategy’s equity from the beginning of the month until the end of the month.
Details:
- Commission
- Leverage
- Investors
- Equity
Description
This section gives you a sneak peek into the mind of the strategy provider and his motto behind that particular strategy. We recommend that you give it a read.
At the bottom of the details panel, you can also see when the strategy was created.
About Trader
This section gives you information about the strategy provider; their name, how long they’ve been with Exness, and where they are from.
To read more about them you can click More details. Under this section, you will find a short introduction of the strategy provider which can give you a useful insight into the personality of the trader and his exposure to forex.
Trading Period
This is a set amount of time between commission payments and ends on the last Friday of the month.
All these details are the most important for investors to consider to find the strategy that suits them the most.
About a Strategys Tolerance Factor
A strategy’s Tolerance Factor refers to the limit placed on the max amount of an investment. This feature protects both investors and strategy providers, operating as a safety mechanism.
The formula used to calculate this looks like this:
Max amount for an investment = strategy equity * tolerance factor
How is the Tolerance Factor calculated:
The Tolerance Factor is a dynamic limit, weighted by the following:
- A strategy’s age: starting from the date of creation, a strategy will gain a factor of 1 every 30 days it remains active. Should the strategy experience stop out, the weight will reset to 0.
- The strategy provider’s verification status: 2 status exists, either fully verified or not fully verified and these are weighted at 2 and 0.5 respectively.
Example: A 90-day old strategy by a fully verified strategy provider calculates the Tolerance Factor as 3*1 + 2 = 5.
If a strategy has an equity of USD 10 000 and a Tolerance Factor of 5, the final calculation would look like this:
USD 10 000 * 5 = USD 50 000 - therefore the limit on the investment would be USD 50 000.
Points to note:
- The maximum tolerance factor is set at 14.
- A strategy’s total investment limit is set at USD 200 000.
What are the requirements for strategy visibility in the app?
As a strategy provider, there are some requirements for strategy visibility on the app. Please find them below:
- Minimum deposit: If you have created a Social Standard account, the minimum deposit is USD 500 and for Social Pro, it is USD 2000.
- KYC: You should fulfill all KYC requirements (including Economic profile).
- Last activity: The last trading activity on the account should have been within the last 7 days (including weekends).
- Minimum trades: The account should have at least 10 closed trades.
- Strategy lifetime: The first order opened on the strategy should be at least 30 days before.
If all the above-mentioned requirements are fulfilled, the strategy will be visible in the Social trading App ratings. To read all about being a strategy provider, check out our article.
Please note that there a few preset filters which are:
- Return: The Return on this account should be greater than 0%.
- Risk score: The Risk Score should not exceed 8.
Users can click on Filters and change these values to view other strategies as per their liking.
What is the risk score about?
The risk score seen in any strategy is a metric that attempts to predict how a strategy might behave in future. Risk considers the free margin of a strategy: the lower the free margin, the higher the chance that the strategy triggers stop out, the higher the calculated risk score. Low free margin more easily results in a strategy’s equity becoming 0, which forces open trades in that strategy to automatically close - this process is known as stop out.
Although the risk score shown in a strategy is based on a 30-day weighted result, the calculation of risk happens daily, only increasing if the score climbs higher than the previous day’s result.
Risk Score Table:
The risk score is measured by a scale of 1-10.
| Risk Score | Level |
|---|---|
| 1- 5 | Moderate |
| 6-8 | High |
| 9-10 | Extra High |
So when you see a risk score of 6, the result indicates high risk. The higher the level, the lower the free margin available to the strategy, the more vulnerable it is predicted to be.
With regards to strategy metrics, Drawdown illustrates what has happened, while risk tries to predict what is to come.
What is Leverage?
Leverage enhances buying power by giving strategy providers the ability to trade large volumes with a smaller amount of funds. It is expressed as a ratio of their own funds to borrowed funds, i.e 1:50, 1:100, 1:200 etc.
The leverage rate is set by the strategy provider when they create the strategy, and cannot be changed.
Leverage in Social Trading
When a strategy provider trades, they can sometimes use a lower leverage rate due to fixed margin requirements. Fixed margin requirements exist for some instruments, such as the Exotic and Crypto instrument groups, regardless of the level of leverage used.
Why are the copying actions unavailable in the application?
It may be due to any of the following reasons:
- If the strategy equity is lower than USD 100 for Social Standard accounts and USD 400 for Social Pro accounts. A strategy provider can make a deposit to increase the strategy’s equity to the minimum requirements of their account type to correct this.
- If the strategy’s total equity (strategy provider equity + all investments’ equity) exceeds USD 200 000. We recommend the strategy provider create a new strategy in this case.
- The strategy provider’s first minimum deposit transaction has not yet been completed. A strategy provider can make a deposit of the minimum required amount for their account type. If a deposit has already been made, it may still take time to reflect in the strategy so check again later.
- If there are less than 3 hours before the market reopens. In such a case investors will see an error notification. They can start copying once the market reopens.
How to measure a strategy’s performance?
When viewing a strategy, there are some indicators to assist investors in making a decision about which strategy to invest in.
Please find the list below:
- Risk Score: The risk score reflects the level of risk taken. The higher the score, the greater the risk and chance of making money, or losing money more rapidly.
- Maximum Drawdown: This parameter indicates the greatest loss the strategy account’s balance suffered during the selected period (options: daily, weekly, last 3 months, last 6 months, last 12 months, 1 year, all-time).
- Commission: This shows the amount of commission paid by investors to strategy providers when an investment returns a profit. This can range from 0-50%.
- Return: This charts the Return seen in a specific strategy. The daily statistics calculate the change in equity from the beginning of the month until the end of the month, offsetting any deposits and withdrawals.
- Investors: This parameter indicates the number of investments copying the strategy at present.
- Leverage: A ratio of the strategy provider’s own funds to borrowed funds, which are invested in a strategy. Higher leverage means increased exposure to the markets due to increase in contract size. Leverage does not impact the Risk Score, however.
How is the Return metric calculated?
Return measures the change of equity seen in a specific strategy. It is updated roughly every 5 minutes with statistics that calculate the change in a strategy’s equity from the beginning to the end of a specified period of time. Let’s see how this calculation happens:
Parts of the calculation are separated into periods between when an account, deposits, withdrawals, or makes any internal transfer actions, collectively known as balance operations (BO). Return is calculated by multiplying all these periods between the balance operations before the answer is presented as a percentile.
In other words, whenever a strategy provider withdraws or deposits, the return calculation is not influenced at all to prevent artificial results.
Return is constantly updated and compounds over time.
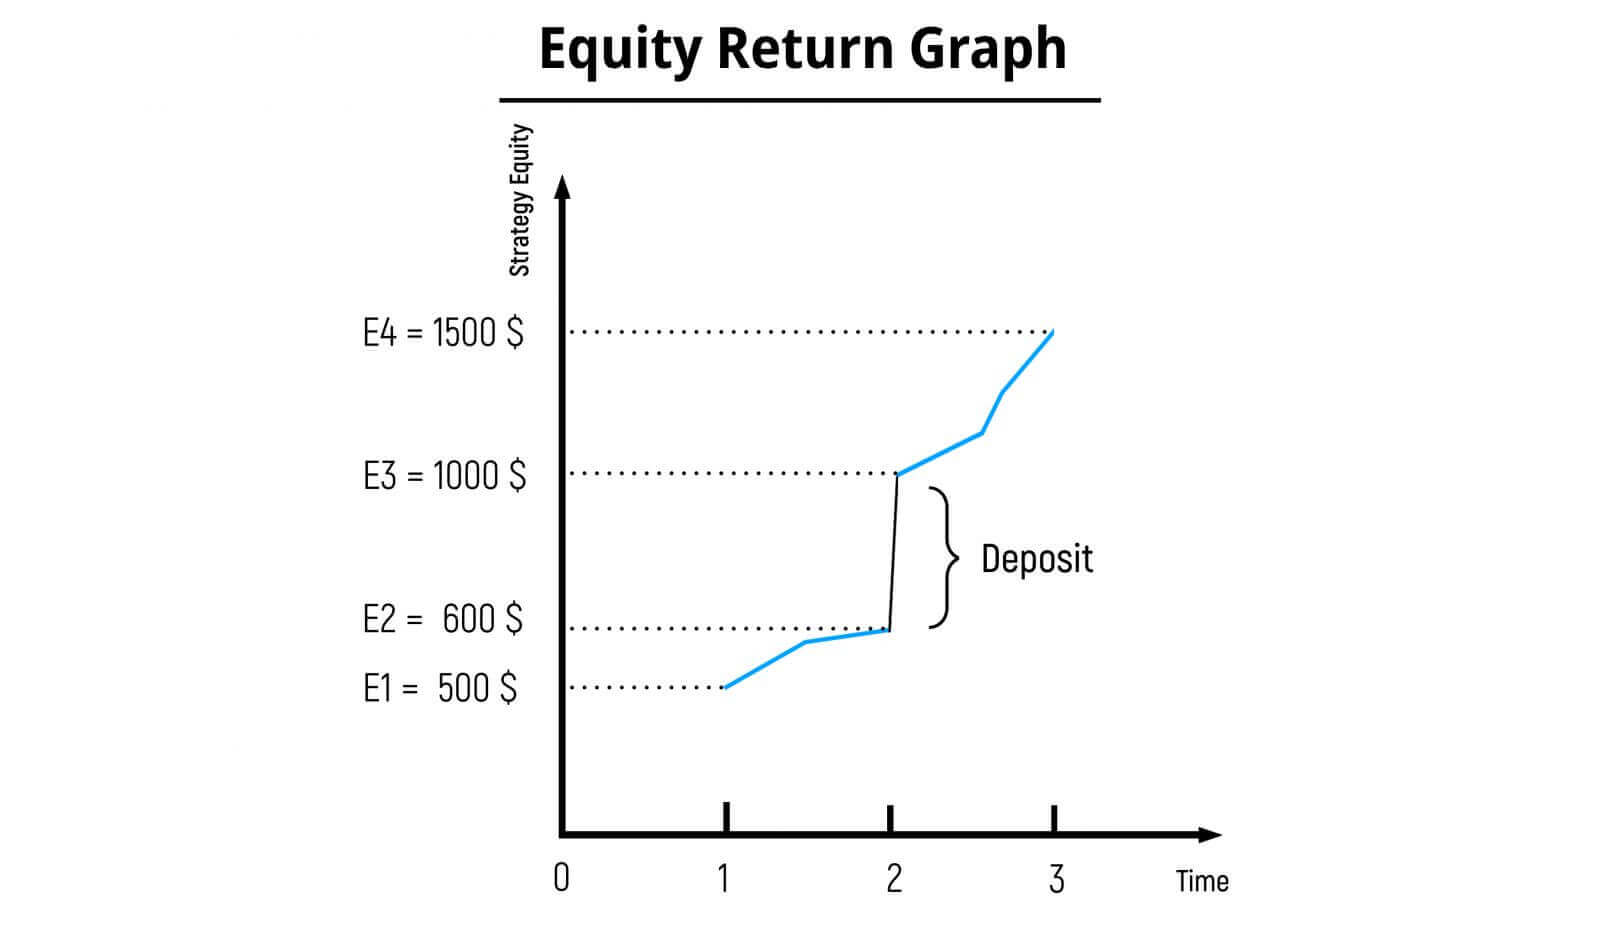
Here’s an example*:
- In January, the strategy’s equity increased from USD 500 (E1) to USD 600 (E2). So Januarys return is calculated: (USD 600 - USD 500) / USD 500 = 0,2 or 20%
- Then the strategy provider made a USD 400 deposit, and the strategy’s equity is adjusted: USD 600 + USD 400 = USD 1 000. So the return calculation in February will start not from USD 600 (E2) but from USD 1 000 (E3).
- In February, the strategy’s equity increased from USD 1000 (E3) to USD 1500 (E4). We can now calculate February’s return: (USD 1 500 - USD 1 000) / USD1 000 = 0,5 or 50%
-
Now we can calculate overall Return:
K1= January Return + 100%, so K1 = 20% + 100% = 120%
K2 = February Return +100%, so K2 = 50% + 100% = 150%
Rolling Return = (K1* K2) - 100%, or (120% * 150%) - 100% = 180% - 100% = 80% So Rolling Return is 80%
Return calculations are strictly made between balance operations (deposits, withdrawals, and internal transfers), of which there is no limit, and that the use of the months of January and February as a time period are for example purpose only.
Basically, Return in previous months is superimposed into ongoing calculations and is only ever reset at the moment of a stop out, continuing as long as the strategy exists.
How does the Reward Wallet in Social Trading work?
The Reward Wallet is a non-trading account that mirrors your Partner Personal Area’s (PA) Reward Account, used to track and manage partner rewards. Both investors and strategy providers can be partners, while the Social Trading app can be used to manage this Reward Wallet.
The Reward Wallet can only be seen in the Social Trading app and your Partner Personal Area if you have successfully referred a client to Exness with your partner link.
In the case a strategy provider is also a partner for an investor, the strategy provider earns commission for both copying the strategy and for their partnership as well. Commission for for copying the strategy is credited to Strategy account, commission for partnership is credited to Reward Wallet
Managing your Reward Account
For iOS users: it is possible to transfer partnership commission from your Reward Wallet to your Social Trading Wallet.
- Open the Social Trading App, and navigate to the Wallet area.
- Your Reward Wallet (if shown) will update and sync with your Partner Personal Area’s Account Balance for you.
- Next, tap Wallet Transfer in Social Trading.
- Choose the amount to transfer.
- The rest is done automatically behind the scenes and your Social Trading Wallet will now reflect an additional amount that you transferred.
For all users: it is possible to withdraw commission from your Reward Wallet using Partner Personal Area (in the Social Trading App this is not possible at the moment).

